
t-Test Application and Interpretation
Student Name
Capella University
RSCH-FPX7864
Professor Name
Submission Date
Introduction
Statistical testing is an important part of many research projects related to the healthcare sector. The t-test is a parametric test that is used to compare the means of two groups to see if the differences found are statistically significant (Qualtrics, 2020). In the current case, the variable “review-1” is a categorical variable that shows attendance at sessions with values labeled as 1 for no and 2 for yes, while the variable “final” is a continuous variable that shows the total number of correct answers to a test. The methodical process enables the development of accurate and evidence-based information regarding the effect of preparatory sessions on students’ performance.
Data Analysis Plan
Research Question
Does a statistically significant difference exist in exam results between students who attend review sessions and those who do not?
Null Hypothesis
No statistically significant difference exists in exam results between students who attend review sessions and those who do not.
Alternative Hypothesis
A statistically significant difference exists in exam results between students who attend review sessions and those who do not.
Testing Assumptions
Levene’s Test Assumption Check
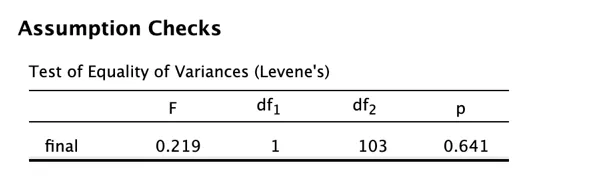
The equality of variances test, which was carried out by Levene, obtained an F-statistic of 0.219 and a p-value of 0.641, indicating that there is no difference in the variance of scores between students who attended the review class and those who did not attend the review class. The p-value is larger than the commonly used threshold for significance, p<0.05, and the significance of the equality is confirmed. So the normal independent samples t-test can be performed. In particular, with degrees of freedom df₁ = 1 and df₂ = 103, the test fails to reject the null hypothesis of equal variances (Aslan et al., 2021). The number of students studied was 105, and the variance of both groups was comparable, so it was possible to easily compare the groups without having to use other tests like Welch’s t-test, since the mean scores were different.
Results and Interpretations
Descriptives
Independent Samples T-Test
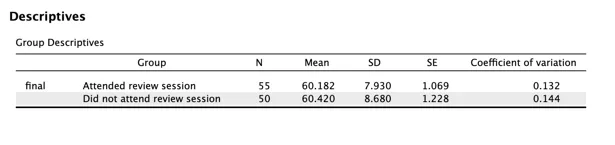
A comparison of independent groups was done to see if there was any effect of participation in the preparatory courses on the results. It involved two groups in the sample: group 1 (55 students) who participated in the preparatory courses, and group 2 (50 students) who did not attend the preparatory courses or workshops. The descriptive analysis showed that the mean score of students who did not attend the supplementary courses (M = 60.420, SD = 8.680) was slightly higher than the mean score of students who attended (M = 60.182, SD = 7.930).
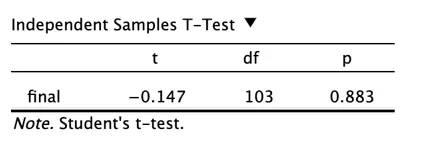
Levene’s test was used to test the assumption of equal variances before proceeding with the hypothesis test. There was no significant difference for the test (F = 0.219, df = 103, p = 0.641) and thus the standard independent samples t-test was used. The scores were compared between the two groups with the t-test: −0.147 (103) < 0, p = 0.883 reported no significant difference between the two groups in scores on the final exam. The value of p is > 0.05; the null hypothesis is therefore not rejected. The fact suggests that there was no difference between the two groups, whether they took the additional preparatory courses or not.
Moreover, the difference between the means was very small (0.238 points) and statistically and practically negligible, since the score represents less than 1% difference in the performance of each group. The standard deviations of 7.930 and 8.680 for the attending and non-attending groups, respectively, further support the fact that the variability in the two groups is similar. The overall findings suggest that the impact of the additional preparatory sessions on the students’ actual assessment scores was not significant, and thus, it is argued that the use of such supplemental sessions does not necessarily lead to improved student performance.
Statistical Conclusion
Analysis of the test data showed a less than 1% difference in the scores of students who attended the review sessions (n = 55, M = 60.182, SD = 7.930) and n = 50, M = 60.420, SD = 8.680 for those who did not. The results of Levene’s test of equality of variances were not significant (F = 0.219, p = 0.641), and therefore the standard independent samples t-test was appropriate. The t-test result showed t (103) = −0.147, p = 0.883, with a mean difference of 0.238 points between the groups. Therefore, there was no rejection of the null hypothesis of no difference in exam performance. Based on the results, it has been found that the current version of the review sessions is not enough to make a positive impact on performance, and there is a need for review of the teaching method, teaching design, or teaching modality.
Limitations and Alternative Explanations
There are a number of methodological issues that may have affected the results. While the independent samples t-test is a good test for comparing the means of two groups, the study does not take into account other factors that may influence the results, such as previous academic achievement or individual study practices. The small sample size (n = 105) may also result in diminished statistical power in detecting smaller but important differences between groups. Also, the yes/no nature of a variable for review session attendance fails to account for other important factors, such as how many times the students attended and the length of review session attendance.
There is the possibility of selection bias: Students who participated in review sessions might have been different from students who didn’t participate in those review sessions with regard to motivation, availability, and other academic demands. The effectiveness of the review sessions may also be influenced by the timing of the review sessions in relation to the final examination. Future studies should use multivariate analysis methods to take into account the confounding variables and examine the effect of preparatory sessions on a wider range of students.
Application
Independent samples t-tests are appropriate for comparing the first-time pass rate for the National Council Licensure Examination for Registered Nurses (NCLEX-RN) for nursing students with different amounts and kinds of clinical simulation to which they have been exposed. For example, the learning approach (high fidelity simulation-based learning versus traditional clinical experience) might be the independent variable, with the dependent variable being the number of successful pass rates on the licensure exam within a set time frame.
As the pass rate on the NCLEX-RN is generally accepted as a major indicator of clinical preparedness and educational quality, the influence of simulation-based learning approaches is a topic that needs to be assessed. It has been proven that using simulation for learning is effective in developing clinical judgment and decision-making skills through experiential learning, which will prepare students for the real-life learning experiences of patients and develop the skills and knowledge they need to become professionals (Vakilabet et al., 2025).
Results can offer evidence-based recommendations for nursing programs working to maximize simulation policies, enhance educational standards, and prepare graduates. Several studies have already established the highly effective results of effective simulation approaches in developing clinical skill and program effectiveness (Jallad, 2024). This method results in well-trained nursing students.