
Data Analysis Plan
Student Name
Capella University
RSCH-FPX7864
Professor Name
Submission Date
The statistical method known as analysis of variance (ANOVA) can be used to compare and test differences between two or more means. The ANOVA test is considered vital for using comparative as well as experimental research designs (Koli, 2024). In the following assessment, the results for correct answers within Quiz 3 are assessed for correct frequency, which shows if there is any divergence.
Section and Quiz 3
A variable that a student is assigned to, and is a type of variable, is the classroom group, which is the variable section. Quiz 3, however, is a continuous variable and measures students’ performance as determined by the number of correct answers given.
Research Question
Is there a statistically significant difference in Quiz 3 scores among students from different classroom sections?
Null Hypothesis (Ho)
There is no statistically significant difference in Quiz 3 scores among students from different classroom sections.
Alternative Hypothesis (HA)
There are statistically significant differences in Quiz 3 scores among students from different classroom sections.
Testing Assumptions
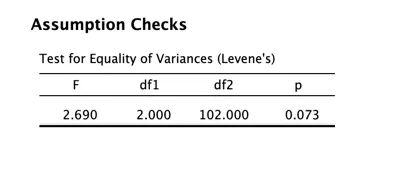
Levene’s test was used to ascertain whether the assumption of homogeneity was met. The test is a conventional practice in checking the equal variance assumption in analysis. Assumption of homogeneity means that the variance is the same for all groups. By performing Levene’s test, following a conventional analysis in checking homogeneity in analysis of variance, F(2, 102) = 2.690, p = 0.073, where df1 = 2 and df2 = 102 were yielded.
The p-value is already large, which means that there is not enough evidence to reject the null hypothesis, so homogeneity is achieved. Based on the evidence, Levene’s test result was not significant, meaning the assumption of homogeneity of variances in ANOVA was valid, and it is appropriate to interpret the differences in group means (Najafi & Nasiri, 2023). However, violation of assumptions has little effect on results in the analysis of variance but can impact precision and/or statistical power.
Results and Interpretation
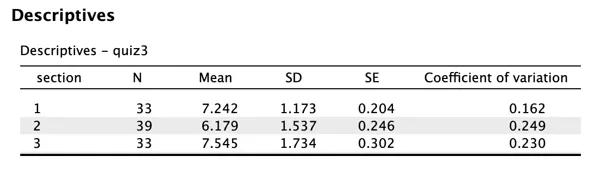
The values for mean (M) and standard deviation (SD) for Quiz 3 outcomes are presented below for all groups, organized according to the section variable.
- Section 1: M = 7.242, SD= 1.173
- Section 2: M = 6.179, SD= 1.537
- Section 3: M = 7.545, SD= 1.734
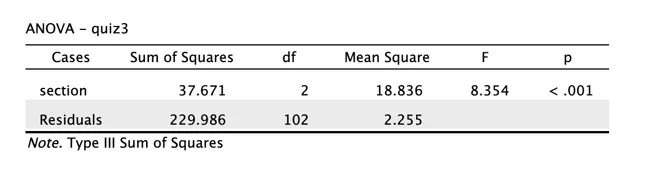
The analysis of the scores from Quiz 3 in the classrooms using one-way ANOVA revealed significant differences in the mean scores of the three sections of the classrooms. The highest average score was obtained by students in Section 3 (M = 7.545, SD = 1.734) followed by students in Section 1 and in Section 2 which obtained a mean of 7.242 and 1.173 and a mean of 7.325 and 1.275, respectively. The mean of the scores of students in Section 2 was 6.179 with a std deviation of 1.537, which was the lowest. A one-way ANOVA indicated that F(2, 102) = 8.354, p < .001, which means that the performance on Quiz 3 was indeed statistically significantly different among the classroom sections.
The fact is very strong evidence in favor of the alternative hypothesis that there were meaningful differences in Quiz 3 scores among sections. The value of the F statistic indicates that the variance among group means was significantly greater than the variance within the groups. The correlation indicated is fairly high between classroom sections and quiz scores. Combined with the results of one-way ANOVA, the researcher was able to make a statement that there were meaningful differences among group means, which means that the classification of groups was correlated with variability in the outcome measure (Hazar & Hazar, 2025).
Moreover, the very small p-value indicates that the noted variations in Quiz 3 scores across the sections are very unlikely to be the product of chance. Therefore, the null hypothesis was rejected and the alternative hypothesis accepted as the findings indicated that there was a significant difference in the performance of Quiz 3 between the classroom sections.
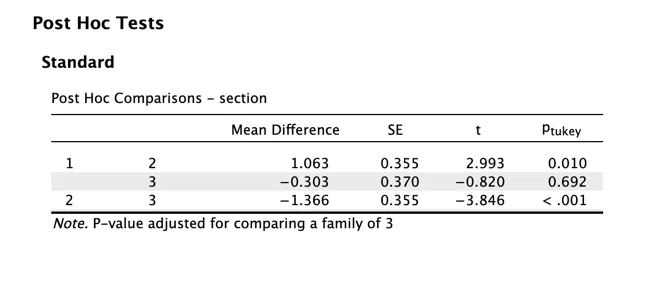
Other comparisons might be achieved by post hoc analysis with Tukey’s HSD, comparing the difference in Quiz 3 scores for any of these three sections. A p-value of < 0.05 was achieved by comparing the data in Section 1 and Section 2. So there is a significant difference between the Quiz 3 scores of Section 1 and Section 2. While the mean scores in Section 1 seemed high when compared with the mean scores in Section 2, it did not reach a 7.242 score. Furthermore, there was a comparison of Sections two and three. The obtained p-value was: 0.001, < 0.05, which means that the difference is statistically significant.
The mean differences among the sections were determined, and it was found that Section 3 had the best mean. A comparison was, however, made between Section 1 and Section 3, and a high p-value was achieved. The value was well beyond the 0.05 value. Therefore, there is no statistically significant difference in cutoffs, and the cutoff in Section Three is slightly higher. The obtained values in the comparison include a t-statistic value of 2.993 in comparing Section 1 and Section 2, and -3.846 in comparing Section two with Section 3.
Results indicated that there were meaningful differences between academic outcomes in specific sections of the classroom, suggesting that section-level resources, including instruction, peer relationships, and classroom climate, could be important factors to consider when examining academic outcomes (Rosen & Kelly, 2023). Overall, the data indicate that there were no significant. Sections 1 and 3 on Quiz 3, but that Section 2 had significantly lower performance compared to the other sections.
Statistical Conclusions
The performance of the different sections on Quiz 3 scores was evaluated using a one-way analysis of variance (ANOVA) statistical test. The results were statistically significant, F (2, 102) = 8.354, p < .001, indicating a significant difference in performance of the different sections of the classroom in Quiz 3. The null hypothesis was rejected. Also, the results revealed (F = 2.690, p = .073) that the data had equal variances as the results of Levene’s test were not significant. The results showed that the mean for Section 1 is M = 7.242 and the standard deviation is 1.173. Section 2’s mean of M = 6.179 and the standard deviation of 1.537 score on Quiz 3 were significantly lower than those of Section 1. Section 3 of the classroom performed the best on Quiz 3 with a mean of M = 7.545 and 1.734 as standard deviation.
Also, Tukey’s honestly significant difference (HSD) was carried out to determine if any section had a higher score than the other sections on the results of Quiz 3. The result indicated that Section 2 was very poor compared to the other sections on Quiz 3, but there was no significant difference between the results obtained from Sections one and 3. The one-way ANOVA indicates that the difference among the group means is statistically significant, so that is the point where it allows that there is a meaningful difference, and hence, other post hoc procedures are recommended that control the Type 1 error, one of these being Tukey’s HSD, which is used here (Hazar & Hazar, 2025). The overall results are in support of the hypothesis, suggesting that instruction, class interactions, or other conditions within the class sections could influence student performance, with very noticeable results differences in Section 2 compared to the other sections.
Limitations
Several limitations need to be considered in discussing the findings of the ANOVA analysis. The identified analysis was found to meet the requirement of homogeneity of variance; although it was not explicitly tested, it was assumed that the data were normally distributed in all groups. The identified issue cannot be eliminated due to the fact that it is inherent in all multiple comparison analyses (Nanda et al., 2021), and the Tukey HSD test is used to reduce Type I error.
Furthermore, no consideration was made of possible underlying causative factors, which may reduce the impact of findings, such as possible differences in teaching methods, course content, and time of evaluation. Finally, an unequal sample size is also possible, though no sample size has been given, for all groups. If the sample size of each class is evenly distributed in a study, the analysis result obtained would be more credible and would give a lot of evidence for making decisions in the field of education.
Application
The ANOVA is a very important statistical tool that is often used in nursing education research and others. For instance, the ANOVA can be used to investigate whether different methods of education used in nursing practice (high fidelity simulation, traditional clinical, and hybrid) have different impacts on student performance on the National Council Licensure Examination for Registered Nurses. In managing nursing education programs, ANOVA helps to determine teaching strategies that have the best impact on students.
Various factors influencing the teaching methods and help getting results which are not easily obtained by other statistical tools are analyzed in ANOVA (Muhammad, 2023). In this type of context, this is why the variables are important in the context of ANOVA. The independent variable would be the type of training strategy or educational approach, including simulation-based training, traditional clinical rotations, structured preceptor models, specific debriefing methods, or any other suitable independent variables. The outcome measures or dependent variables would be nursing competence outcomes such as clinical skill assessment scores, competency ratings, licensing examination performance, and/or measures of learning transfer.
A one-way ANOVA would then be used to see if the mean competency scores for the different types of training are significantly different. Statistically significant differences would suggest that the type of educational strategy has a significant impact on student competence as a nurse, providing evidence for curriculum design and preparedness of graduates in nursing. The results of the study showed that training strategies have a significant effect on nursing graduates, and insufficient training and delayed licensure affect competency outcomes (Najafi & Nasiri, 2023). Therefore, rigorous, evidence-based analytical models, such as ANOVA, are essential to further nursing education. Results from ANOVA can aid in improving graduate outcomes and ensuring a well-prepared nursing workforce.